
The Deal Machine: Understanding M&A in Beauty and Wellness
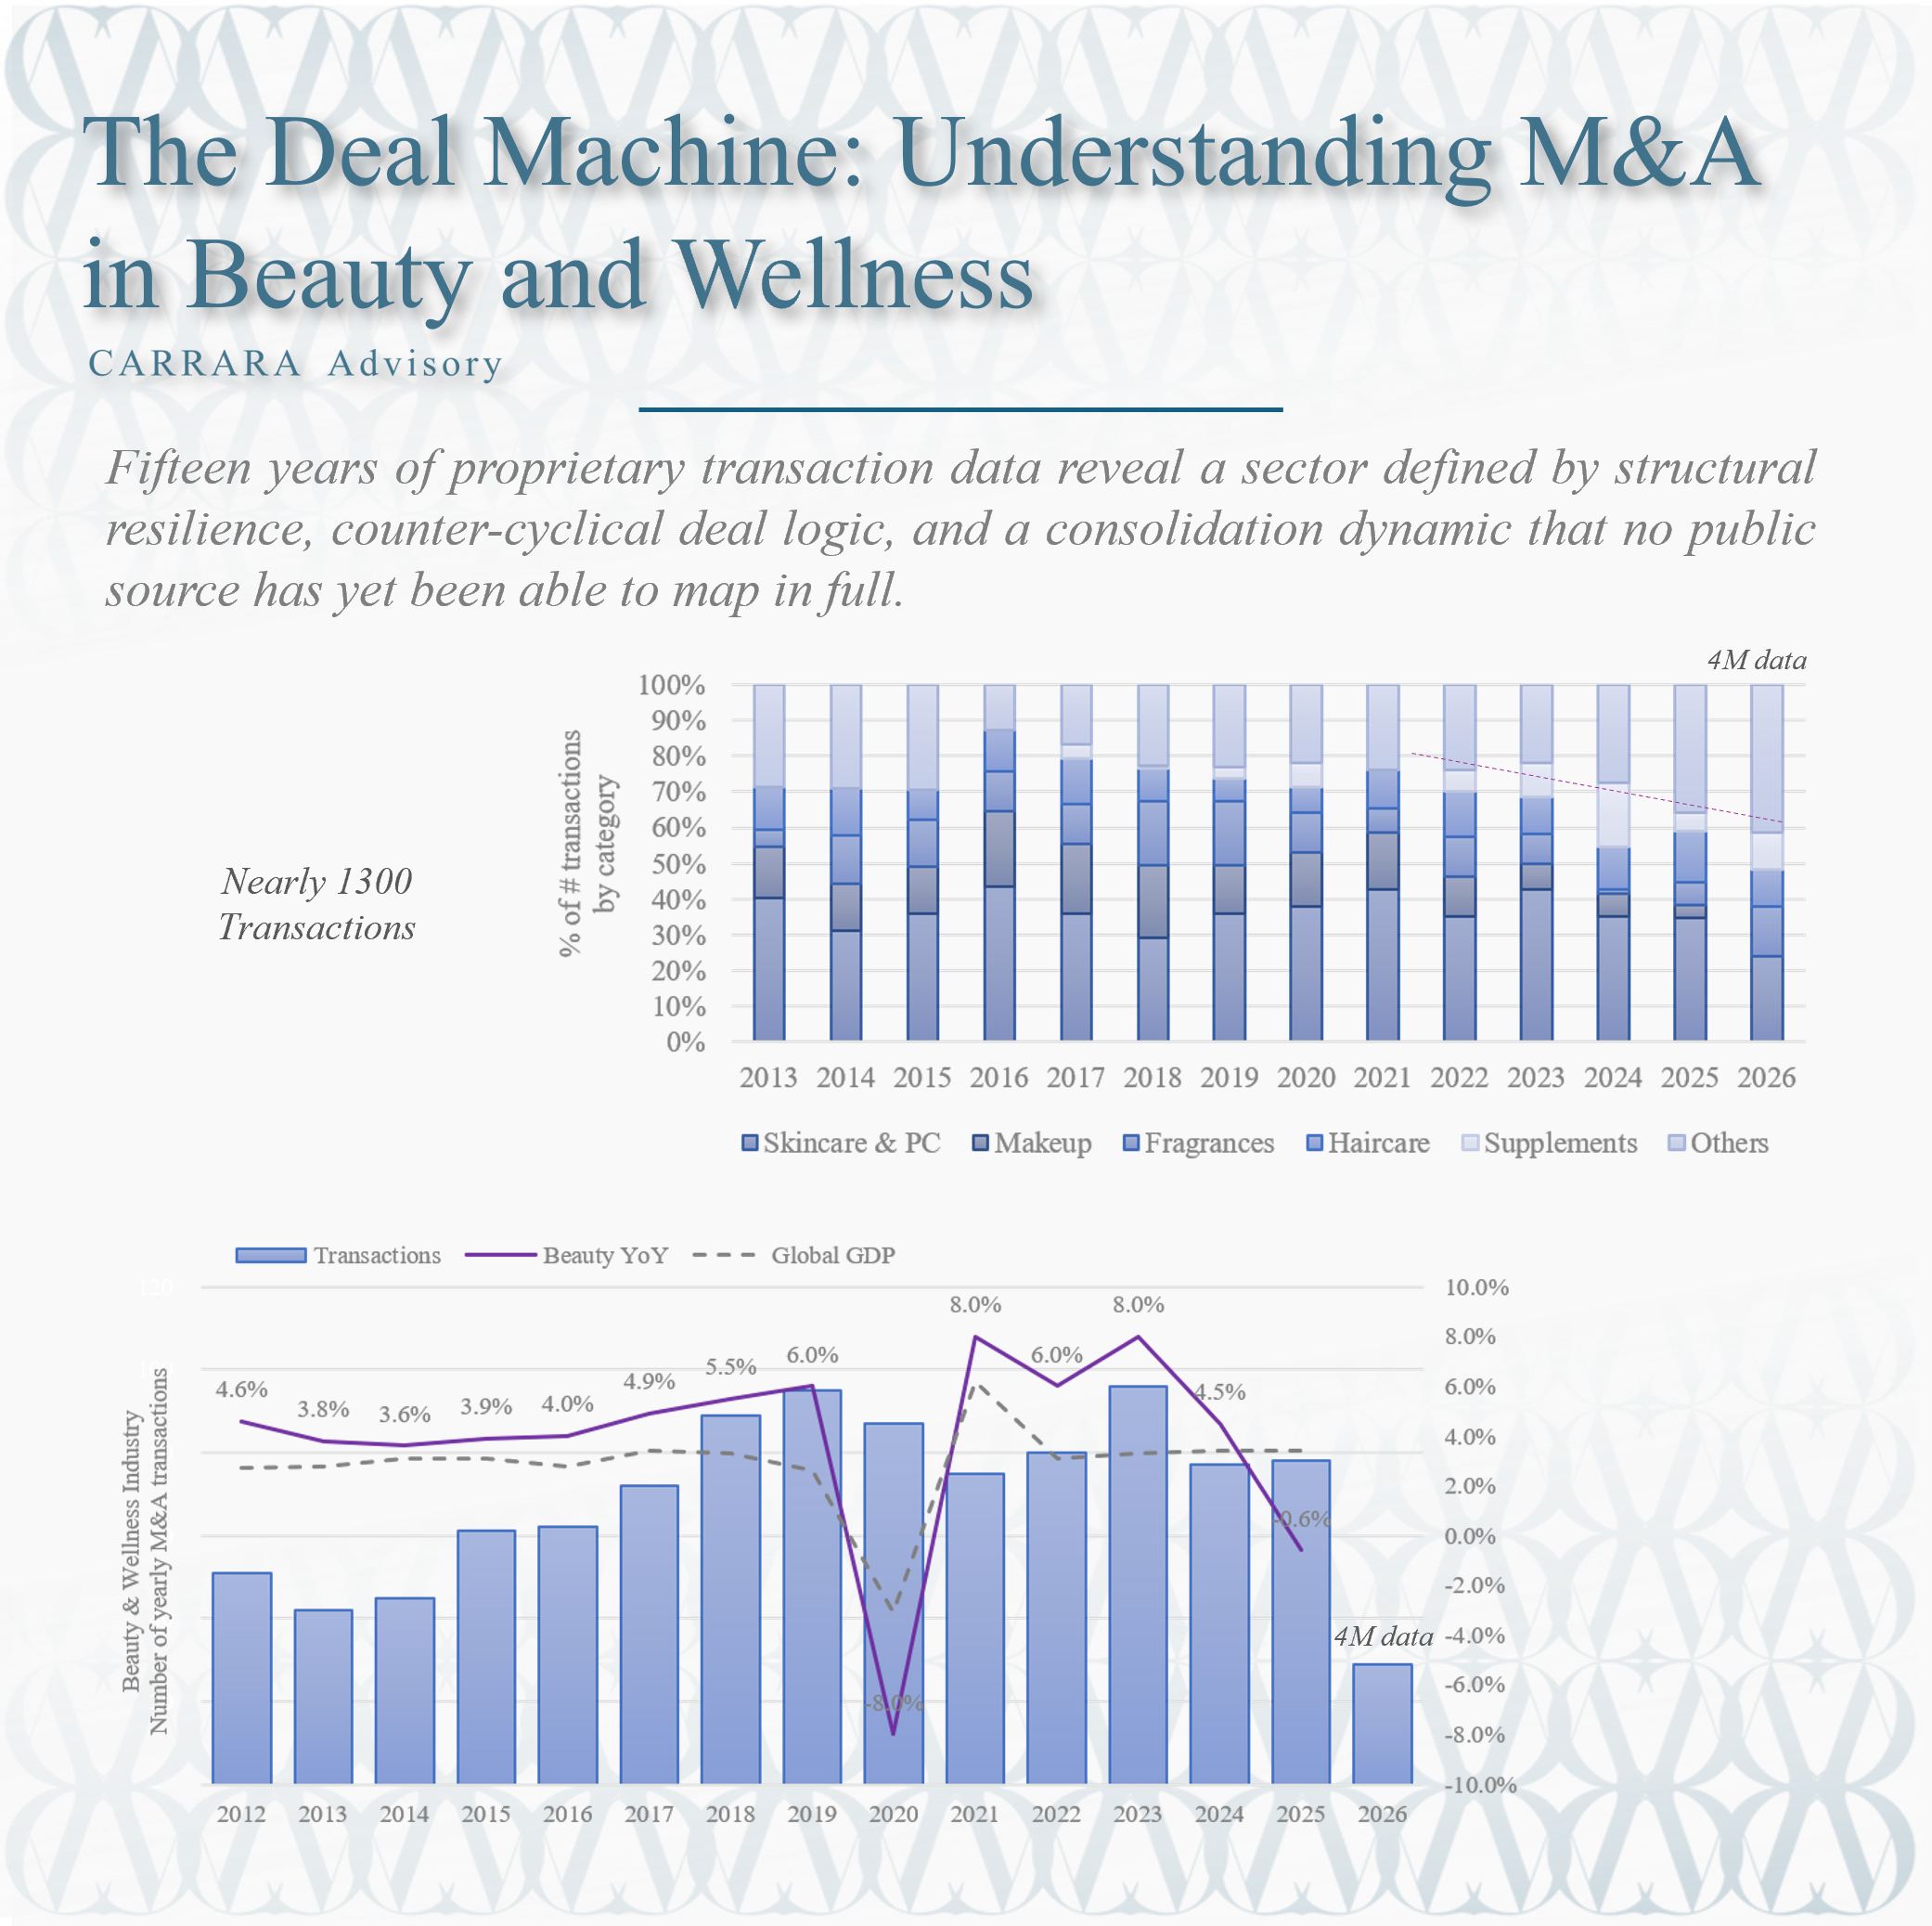
Fifteen years of proprietary transaction data reveal a sector defined by structural resilience, counter-cyclical deal logic, and a consolidation dynamic that no public source has yet been able to map in full.
EXECUTIVE SUMMARY
Our proprietary database, covering nearly 1,300 full buyout and majority investment transactions from 2010 to the present, establishes what no public source can: a granular, longitudinal picture of M&A dynamics across every major category in beauty and wellness. The data reveal a sector that has compounded deal volume at pace, demonstrated a structural resistance to macro and trading downturns that sets it apart from most consumer categories, and evolved its areas of strategic focus in ways that illuminate where capital sees the most durable value.
BONUS: M&A Diagnostic tool available here
WHY BEAUTY M&A COMMANDS ATTENTION
Beauty and wellness occupies a unique position among consumer sectors. Its underlying demand is non-cyclical in nature, driven by behavioral habits and self-care routines that consumers protect even as discretionary budgets compress. This characteristic, more commonly described as the lipstick effect but operating at far greater structural depth, has historically translated into premium M&A multiples and attracted a broadening universe of acquirers: from strategic conglomerates to private equity firms, family offices, and crossover investors from adjacent sectors including health, pharma, and food.
The sector has also benefited from the convergence of beauty and wellness as consumer categories. Products that once sat in clearly distinct aisles, ingestible supplements, topical skincare, haircare, and color cosmetics, increasingly address common consumer goals around longevity, skin health, and self-expression. This convergence has widened the acquisition perimeter for many strategic buyers and created new entry points for financial sponsors seeking category-level platforms.
M&A in this space is further animated by the particular economics of beauty brands. The combination of high gross margins, strong consumer loyalty, and relatively low capital intensity creates a financial profile that lends itself to roll-up strategies and leveraged acquisition structures alike. When a brand reaches a certain size, its economics become difficult to replicate organically; acquisition is frequently the more efficient growth path for larger players.
THE CARRARA ADVISORY DATABASE: SCOPE AND METHODOLOGY
Our proprietary transaction database currently holds close to 1,300 individual deals, encompassing full buyouts and majority investments across the beauty and wellness landscape. Coverage extends from 2010 to the present, giving the dataset a time span sufficient to capture multiple market cycles, the rise and partial correction of direct-to-consumer brands, the acceleration of wellness into the mainstream, and the evolution of manufacturing and supply chain as strategic assets.
The database covers nine primary categories: Skincare and Personal Care, Makeup, Fragrances, Haircare, Beauty Manufacturing and Suppliers, Nutraceuticals, Nutricosmetics, Beauty Retail, and Others (which includes digital platforms, apps, and services that do not fall within the above). Categories such as Beauty Retail, Manufacturing and Suppliers, Nutraceuticals, and Nutricosmetics were tracked separately only from approximately 2023 onward; transactions in these categories prior to that date are included within Others in earlier periods. This tracking evolution reflects the growing strategic relevance of those sub-segments, not a discontinuity in deal activity.
The dataset is limited to full buyouts and majority investments. Minority stakes, licensing deals, joint ventures, and earn-out structures without majority transfer are excluded. This boundary ensures that the transactions captured represent genuine changes of control, where an acquirer is making a commitment to own and operate the asset, and where meaningful valuation and structural information is typically available.
Built on a proprietary database of nearly 1,300 beauty and wellness M&A transactions spanning fifteen years, CARRARA Advisory has developed one of the sector's most extensive transaction intelligence platforms. Leveraging this unique dataset, we created AIVALS™, a proprietary valuation algorithm specifically engineered to analyse and benchmark beauty and wellness companies.
The model explains approximately 94% of historical EV/Sales multiple variation and predicts observed transaction multiples with an average deviation of approximately 0.6x. As a result, AIVALS™ provides a highly reliable valuation benchmark for M&A planning, strategic decision-making, capital raising, portfolio management, and corporate development initiatives across the beauty and wellness ecosystem.
VOLUME THROUGH TIME: A FIFTEEN-YEAR ARC
Transaction volume in the dataset grew from a modest base of fewer than 25 deals per year in the early 2010s to a sustained run rate above 75 deals annually from 2018 onward, reaching a peak of 95 transactions in 2019 and 96 in 2023. Exhibit 1 captures the Q1 (January through March) trajectory across all seventeen years tracked, offering a consistent seasonal window to observe structural momentum independent of year-end closing patterns.
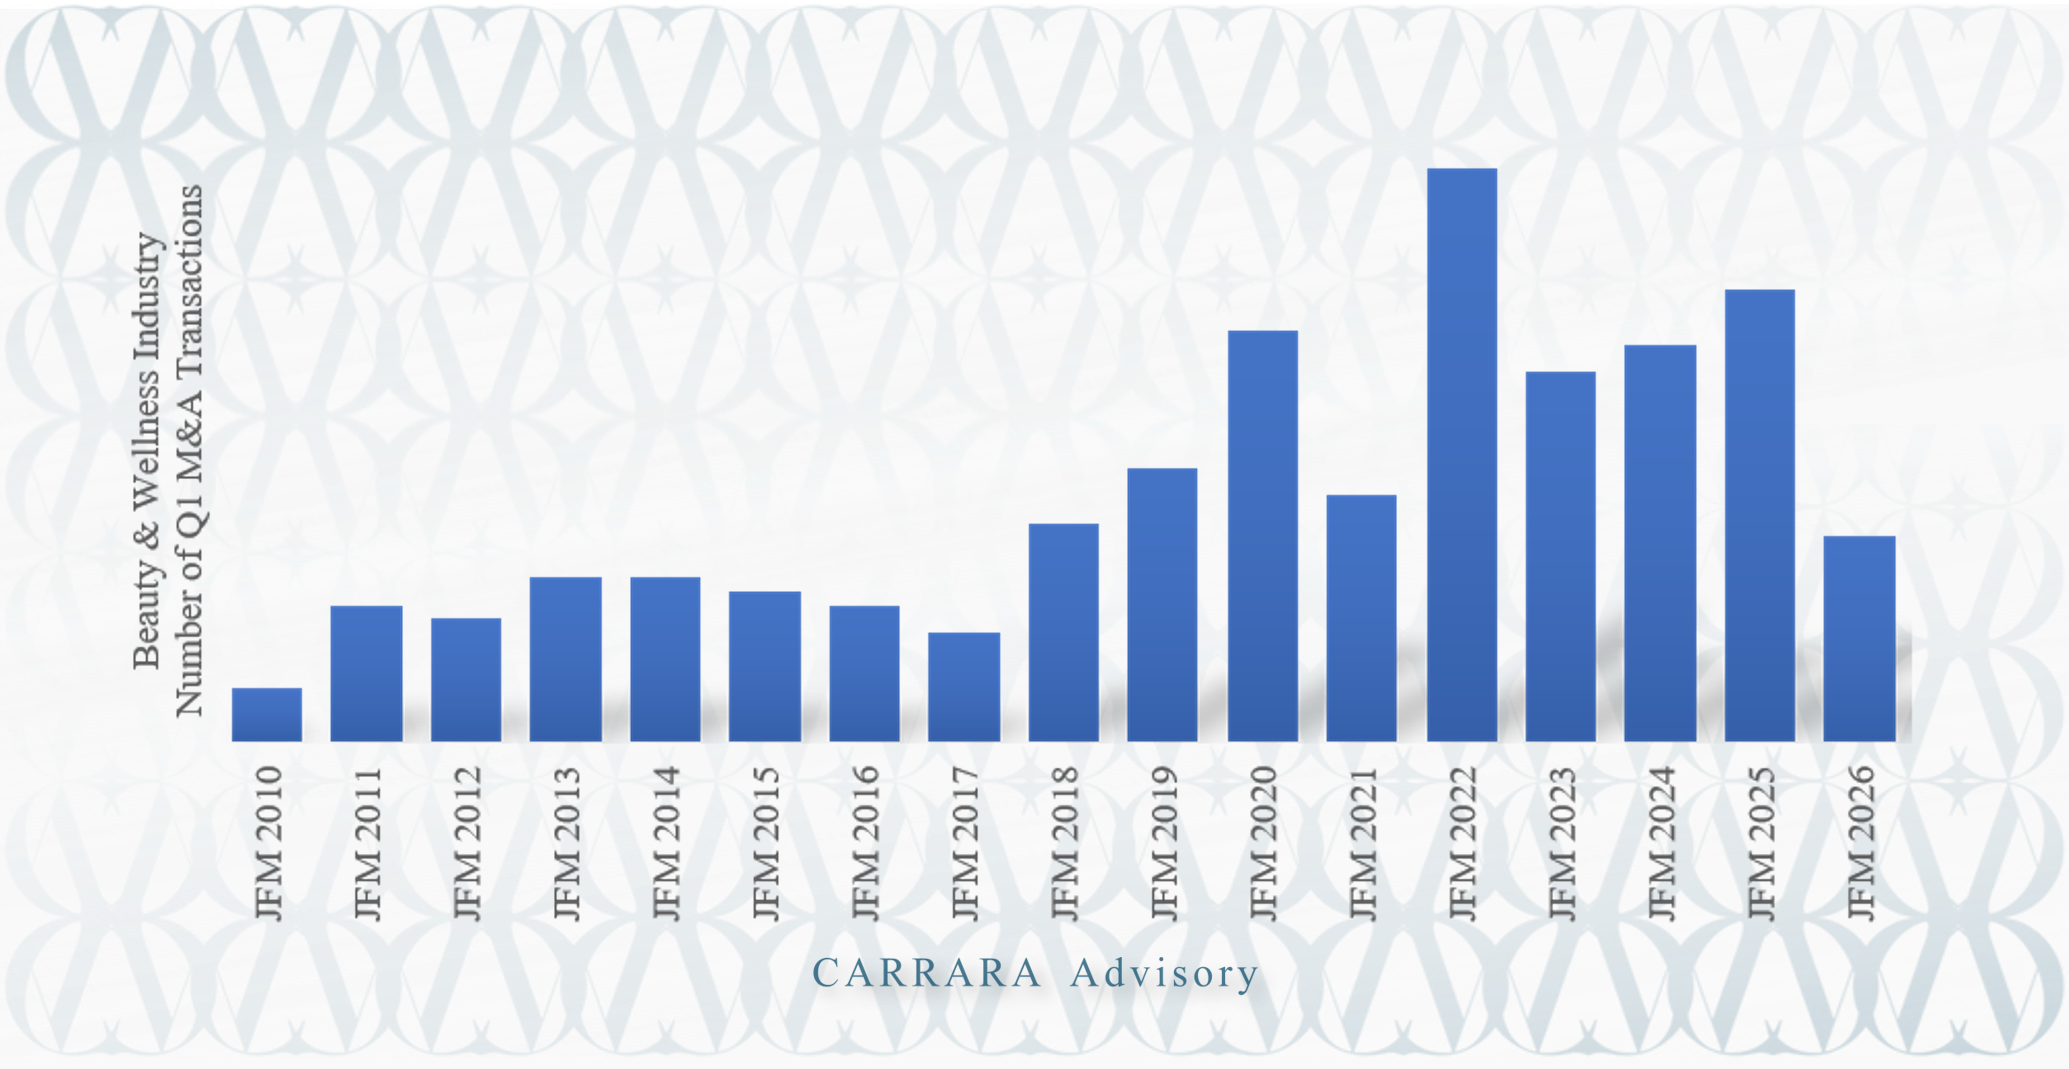
Exhibit 1: Transaction volume, Q1 (January–March) by year and category. Beauty Retail, Manufacturing/Suppliers, Nutraceuticals, and Nutricosmetics were tracked as separate categories only from approximately 2023; prior transactions in these categories are included within Others.
The Q1 trajectory tells a story of compounding deal activity with two distinct acceleration phases. The first, from roughly 4 deals in Q1 2010 to 20 in Q1 2019, reflected the organic growth of the acquirer universe and the maturation of beauty as a private equity asset class. The second phase, visible from 2022 onward, was characterized by a structural expansion of the target universe as manufacturing, supply chain, and wellness sub-categories emerged as investable segments in their own right. Q1 2024 and Q1 2025, at 29 and 33 transactions respectively, confirm that this expanded universe has sustained deal pace well above the levels that characterized the pre-2018 market.
Q1 2026, at 15 transactions, sits below the prior two comparable periods but remains above the levels that defined the first half of the dataset. As discussed in the macro section below, this moderation is consistent with a financing environment that remains tighter than the 2021 to 2023 peak period, and with the broader measured pace of deal-making observed across consumer sectors in the current context. It does not represent a structural retreat.
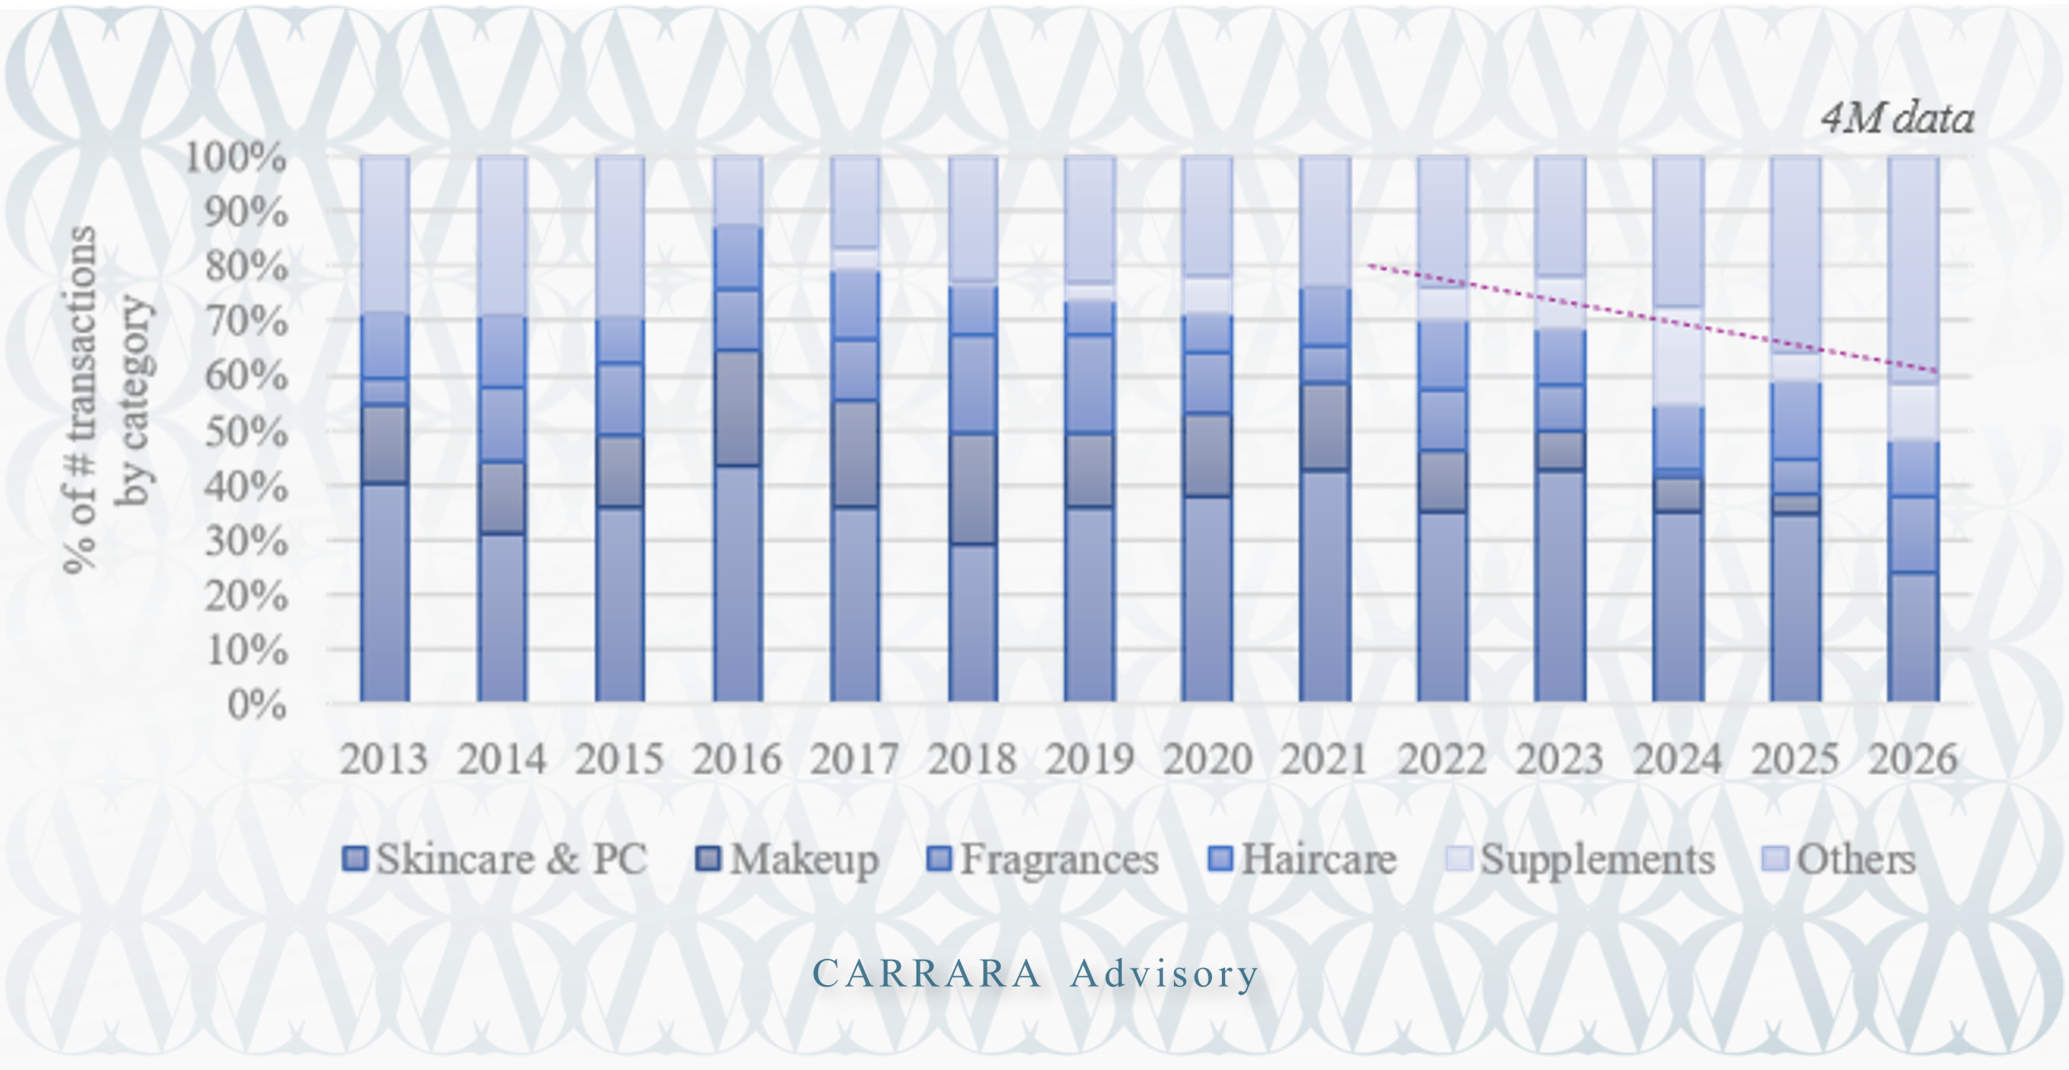
Exhibit 2: Full-year transaction volume by year and category (2026 reflects Q1 only). * Others includes digital platforms, apps, and services, as well as Beauty Retail and Nutricosmetics for years prior to 2023 when those categories were not tracked separately. † Full-year totals reflect the master transaction count and may differ from the sum of category columns due to deals not yet assigned to a specific category at time of publication.
THE MACRO RELATIONSHIP: DEAL VOLUME, BEAUTY GROWTH, AND GDP
One of the most analytically valuable outputs of a dataset spanning fifteen years is the ability to examine how M&A activity in beauty correlates, or does not correlate, with the macro and sector-level growth environment. Exhibit 3 sets the full-year transaction count against annual beauty industry revenue growth and global GDP growth for each year in the dataset. The findings are counter-intuitive in important ways and carry direct implications for how investors and operators should read the current environment.
M&A Volume Does Not Follow Beauty Revenue
The most fundamental observation from Exhibit 3 is that deal volume and beauty revenue growth are largely uncorrelated on an annual basis. Beauty revenue grew at 4 to 6 percent annually between 2014 and 2019, and deal volume grew broadly in parallel over that period. But in 2020, when beauty revenue contracted 8 percent in one of the worst years in the sector's recent history, deal volume fell only from 95 to 87, a decline of just over 8 percent against a revenue decline ten times that magnitude. More strikingly, in 2025, when beauty growth turned negative at -0.6 percent against a backdrop of positive 3.4 percent global GDP growth, deal volume actually held at 78 transactions, virtually flat with 77 in 2024 and meaningfully above the 75 recorded in the strong-growth year of 2021.
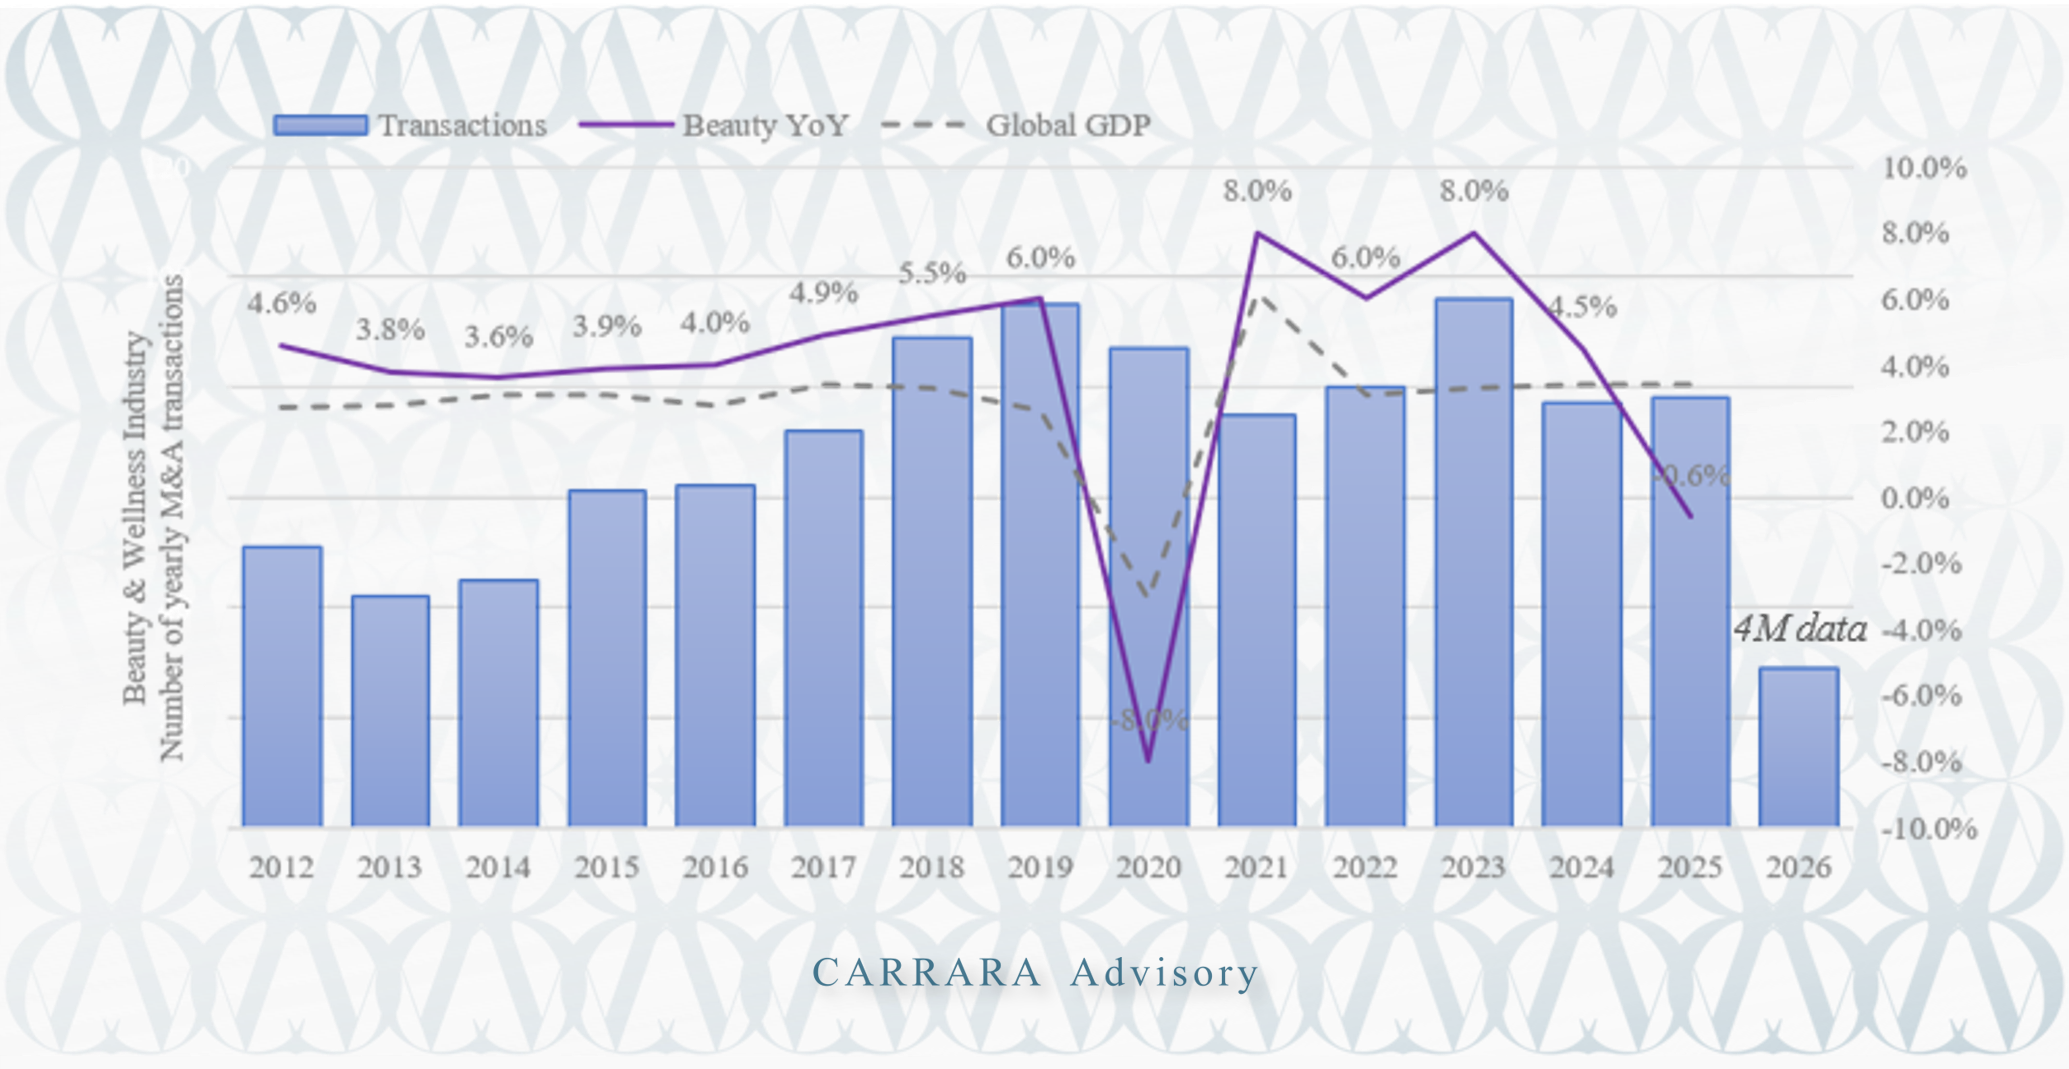
Exhibit 3: Annual transaction volume versus beauty industry revenue growth and global GDP growth. The Deals / Beauty Growth Point ratio is calculated as total transactions divided by the beauty YoY growth rate in percentage points; n/m indicates not meaningful due to negative beauty growth. Beauty growth figures are global industry estimates; GDP growth figures are IMF World Economic Outlook data.
