The Deal Machine: Beauty and Wellness M&A Multiples, Decoded

Building on our prior analysis of deal volume, we turn to the question every buyer, seller, and board member eventually asks: what multiple is the market actually paying? A category by category, cycle by cycle review of EV/Revenue and EV/EBITDA multiples across nearly two decades of beauty and wellness transactions reveals a market that rewards efficacy and scarcity far more than it rewards category alone, and a 2025 that looks less like an aberration than like the opening chapter of a new valuation regime.

EXECUTIVE SUMMARY

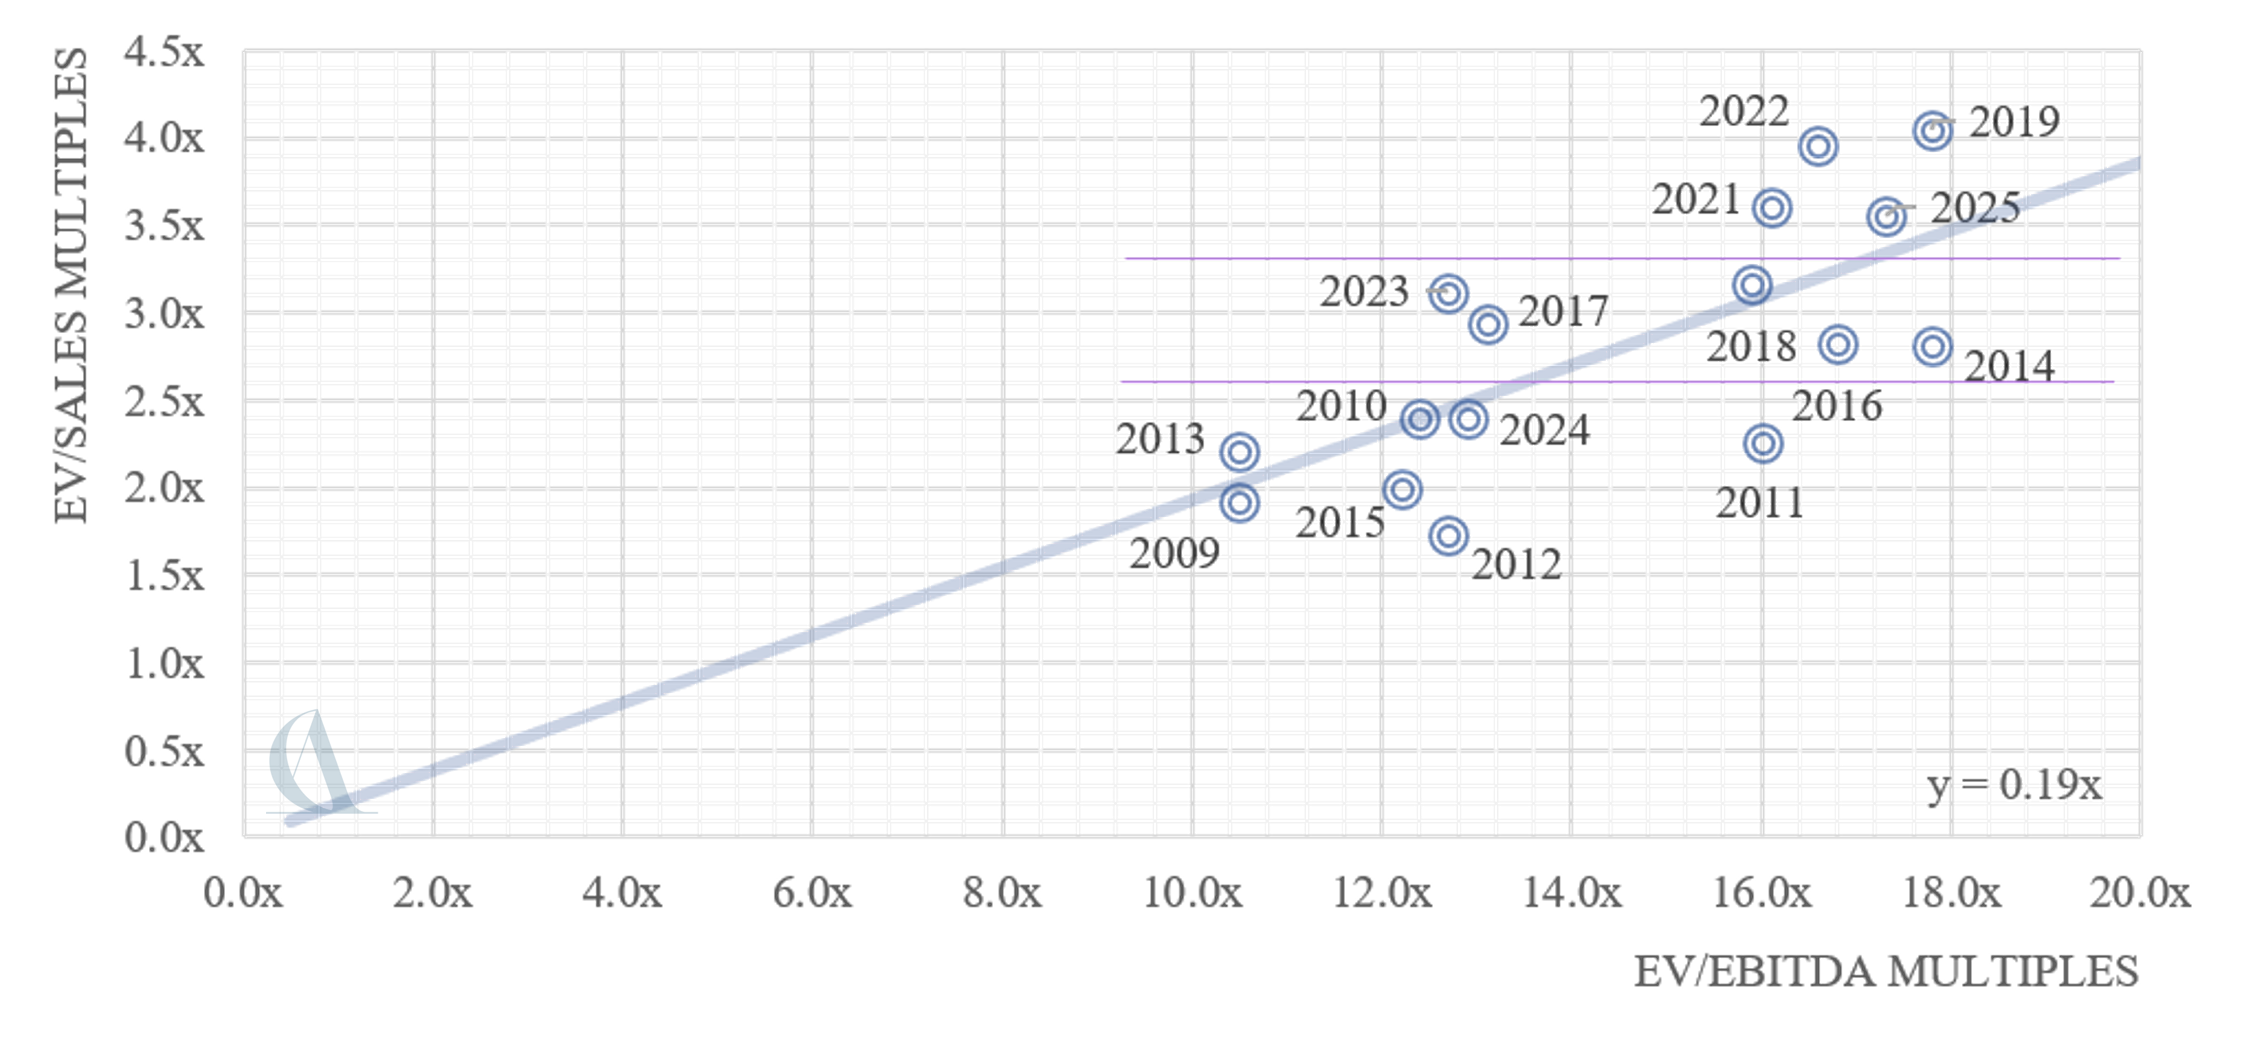
Drawing on our proprietary transaction database, this issue examines valuation multiples paid in beauty and wellness M&A between 2009 and 2025, split by category and matched against EV/EBITDA. The headline figures are straightforward to state and more complex to interpret. The average EV/Revenues multiple paid across all deals held in a relatively narrow band of 1.7x to 2.9x between 2009 and 2017, then stepped up to a new range of roughly 3.2x to 4.0x from 2018 through 2022, dipped back toward 2.4x in 2024, and then jumped again to 3.6x in 2025. EV/EBITDA followed a similar but noisier arc, moving from roughly 10x to 13x in the early part of the period to a range of 16x to 21x from 2016 onward.

Underneath these averages, however, sits a far more interesting story about dispersion, category rotation, and the growing gap between the price paid for a merely good asset and the price paid for a truly scarce one. Skincare and personal care has, on average, commanded the deepest and most liquid market for transactions, but it has also produced some of the widest swings in pricing, from distressed sub 1x revenue deals to a small number of transactions north of 14x. Fragrance, historically a steadier and more moderately priced category, has in the past eighteen months produced the single highest multiple in the entire dataset. Ingestibles and supplements, meanwhile, have quietly built one of the most consistent risk adjusted pricing profiles of any category, rarely straying far from a tight band of revenue and EBITDA multiples that suggests a market with a genuinely shared view of fair value.

We exclude 2026 year to date figures from our trend conclusions given the small sample available at time of writing, though we reference several individual 2026 transactions where they illustrate a broader point. What follows is organized in four parts: the long arc of average pricing since the financial crisis, the category level dispersion that the averages conceal, the relationship between revenue and EBITDA multiples as a lens on margin quality, and the practical implications for anyone contemplating a beauty or wellness transaction in the current environment.

BONUS: M&A Diagnostic tool available here

THE LONG ARC: FROM POST CRISIS DISCOUNT TO STRUCTURAL PREMIUM

The starting point for any discussion of beauty valuation is the observation that multiples in this sector have never been flat for long. Average EV/Revenue multiples across all recorded transactions moved from 1.9x in 2009 to 2.4x in 2010, then held in a 1.7x to 2.9x range through 2017, a period defined by the aftermath of the global financial crisis, the slow rebuilding of consumer credit and discretionary spending, and a beauty M&A market that was still primarily the province of a handful of large strategic acquirers rather than the broad universe of financial sponsors, family offices, and crossover investors that participate today.

The inflection begins in 2018, when the average EV/Revenue multiple crossed 3.0x for the first time and EV/EBITDA reached 15.9x. This was not a coincidence of timing. It corresponds closely with the period in which direct to consumer beauty brands, having built loyal followings through social media and influencer marketing, began to demonstrate that a digitally native brand could scale gross margin and customer acquisition economics that looked meaningfully different from a traditional wholesale dependent business. Financial sponsors, having watched strategics such as Unilever and Estee Lauder pay rich multiples for early movers in this space, began underwriting their own theses on brand equity and community, and the resulting competition for a limited number of scaled, profitable targets pushed pricing higher across the board, not only for the digitally native brands themselves but for the broader category of skincare, personal care, and wellness businesses that shared some of their characteristics.

That premium era reached its high water mark in 2019 and again in 2020 through 2022, with average EV/Revenue multiples of 4.0x, 3.8x, and 3.6x respectively, and EV/EBITDA multiples that touched 20.9x in 2020, a year in which the underlying beauty industry actually contracted in revenue terms due to pandemic related retail closures. This apparent contradiction, rising deal multiples against a backdrop of falling sector revenue, is worth dwelling on because it illustrates a structural feature of beauty M&A that recurs throughout the dataset: buyers are pricing forward positioning and brand durability, not trailing financial performance. The pandemic period accelerated e-commerce adoption, clean and self-care positioning, and at-home beauty routines in ways that made certain categories, particularly skincare and haircare with strong digital distribution, look structurally more valuable even as reported industry revenue softened.

The subsequent moderation in 2023 and 2024, when average EV/Revenue multiples eased to 3.1x and then 2.4x, reflects a more conventional financing story. Interest rate increases through 2022 and 2023 raised the cost of acquisition financing across every consumer sector, private equity fundraising slowed, and the aggressive multiples paid during the zero rate era for unproven digitally native brands were increasingly hard to justify as several high profile direct to consumer names struggled to sustain growth once customer acquisition costs normalized upward across paid social platforms. Industry commentary from advisory firms tracking the sector describes a market in which private equity buyers pulled back through much of 2025 given macroeconomic uncertainty, even as strategic buyers and private beauty focused firms continued to transact, a dynamic that helps explain why deal volume proved far more resilient than deal pricing during the softer years of the cycle.

The sharp rebound to 3.6x average EV/Revenue in 2025 is therefore best read not as a simple return to 2019 conditions but as evidence of a market bifurcating in real time. Rate cuts beginning in the autumn of 2024 restored some financing capacity, but the deals actually closing in 2025 increasingly clustered at the high end for a small number of scarce, high quality assets while the broad middle of the market continued to trade at compressed levels. Beauty has structurally traded at a premium to the broader consumer M&A market for most of the period we reviewed, a function of higher typical margins and demand that holds up better through downturns. That gap widened further in 2025, reaching more than five turns of EBITDA, as general consumer M&A multiples fell to their lowest level in a decade even as beauty pricing held firm, itself a signal of how differently the market is treating the two categories right now.

CATEGORY DISPERSION: THE AVERAGE HIDES THE STORY

Aggregate multiples are useful for establishing the overall temperature of the market, but the category level data is where the more actionable insight lives. Four patterns stand out.

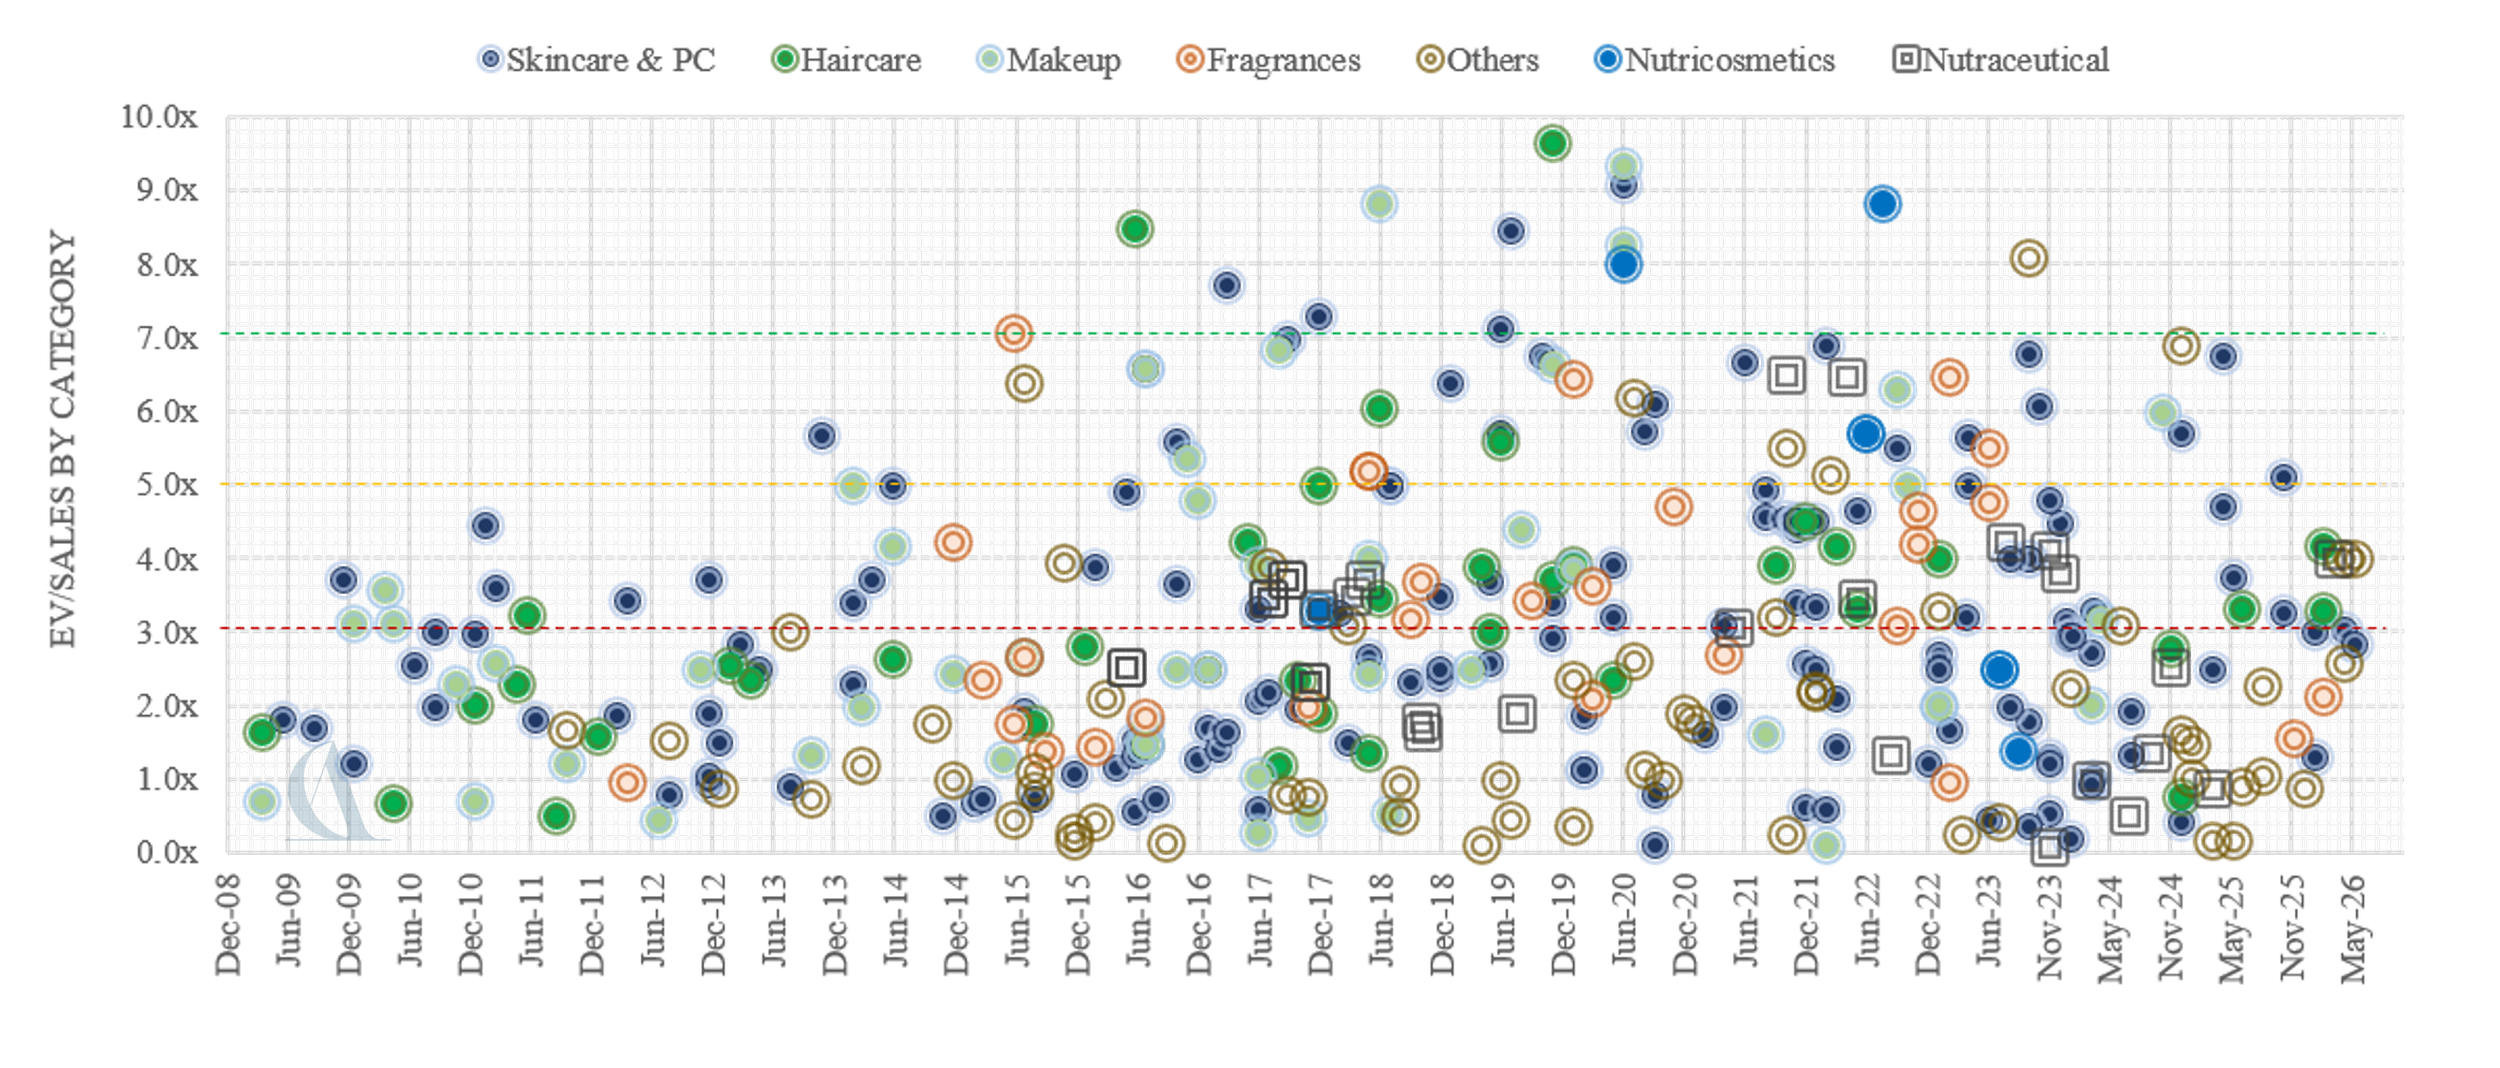
Skincare and personal care is the deepest market and the widest one. Across close to two decades of transactions, skincare and personal care has produced both some of the lowest multiples in the entire dataset, transactions below 1x revenue reflecting distressed sales, underperforming assets, or businesses with limited brand differentiation, and some of the highest, including several transactions above 6x revenue in 2019, 2021, and 2023, and outliers reaching into the double digits in 2020, 2022, and again in 2025 and 2026. This dispersion is not noise; it is the clearest quantitative expression of a market that has become dramatically more discerning about what within skincare actually deserves a premium. A brand with genuine clinical credentials, dermatologist support, or a proprietary active ingredient platform increasingly trades in a different universe from a brand built primarily on trend driven formulation and marketing spend. Advisory commentary from late 2025 and early 2026 consistently points to dermatological positioning and clinically proven efficacy as the clearest differentiators separating premium priced skincare transactions from the rest of the category, a pattern entirely consistent with what the multiple dispersion in our dataset shows.

Fragrance has moved from a steady, moderately priced category to the site of the single largest multiple in the dataset. For most of the period covered, fragrance transactions clustered in a fairly conservative 1x to 3x revenue range, with occasional premium deals reaching 4x to 7x. That changed abruptly in the second half of 2025, when a fragrance transaction closed at 16.5x revenue, by a wide margin the highest multiple recorded for any deal in any category across the entire dataset. This is not an isolated statistical curiosity. It coincides with a period in which several of the most closely watched transactions in the broader beauty industry involved fragrance assets: reports around this time described a major luxury conglomerate paying a double digit revenue multiple for a historic fragrance house as part of a broader strategic agreement securing decades long beauty licensing rights across some of its most valuable fashion houses. Fragrance has clear structural advantages that support this kind of premium pricing: high consumer willingness to pay, strong margin potential once a brand achieves distribution scale, durable licensing economics, and a growing appetite among consumers, particularly younger consumers discovering niche and artisanal scent brands through social media, for fragrance as a form of self-expression and even, according to several recent industry surveys, mood management. The category's relatively small deal count compared to skincare makes it more prone to single transaction distortion, but the direction of travel, toward a smaller number of high conviction, strategically vital fragrance acquisitions commanding exceptional multiples, appears to be a genuine and durable shift rather than a temporary spike.

There is also a more structural explanation worth drawing out, because it changes how the fragrance premium should be read. A closer look at recent fragrance dealmaking shows that almost every transaction pricing at the very top of the range shares one characteristic: the acquirer is buying a brand and its underlying intellectual property outright, not a licensing agreement to distribute someone else's name. The historic fragrance house acquired for a double digit revenue multiple in 2025 came with full ownership of the brand, its formulas, and its heritage, plus decades long exclusive rights to develop fragrance and beauty lines for several major fashion houses going forward. A comparable dynamic played out a few years earlier when a Spanish beauty and fashion group paid close to a billion dollars for majority control of a niche, gender neutral perfume house built entirely on owned intellectual property, reportedly outbidding a larger conglomerate rival in the process. Owned brands of this kind carry none of the renewal risk that defines the traditional licensed fragrance model, in which a specialist perfume house pays a royalty to a fashion or luxury brand for the right to develop and distribute scents under that name for a fixed term, and can lose the entire revenue stream if the license is not renewed. Several long established licensing specialists have flagged exactly this risk in recent disclosures, pointing to the scheduled expiration of a major license as a specific, near term threat to revenue. A buyer paying sixteen times revenue for an owned, IP rich fragrance asset is not pricing the same risk profile as a buyer paying three times revenue for a business built on a renewable license, and the growing wedge between what the market pays for owned niche luxury fragrance IP and what it pays for licensed distribution rights is, in our view, a large part of the story behind the category's headline grabbing 2025 outlier. Expect this gap to persist, and likely widen, as niche and independent perfume houses continue to attract capital specifically because they come with durable, wholly owned brand equity rather than a royalty agreement with an expiration date.

Ingestibles and supplements show the tightest, most disciplined pricing of any category. Reviewing the individual transactions in this category across the available years, the great majority fall within a relatively narrow band of 1x to 4x revenue and 10x to 20x EBITDA, with very few outliers in either direction until a single 30x revenue transaction recorded in 2026, a figure so far outside the historical pattern that it should be treated as an early data point rather than evidence of a new baseline. This consistency likely reflects the more mature, more standardized nature of the supplements and nutraceuticals M&A market relative to brand driven categories like skincare and makeup: buyers in this space are frequently evaluating businesses against clearer regulatory, manufacturing, and distribution benchmarks, and the category has had more time to develop a shared market view of appropriate pricing. It is also the category most directly positioned at what several advisors now describe as the wellness bridge, the point at which beauty, longevity, and preventive health increasingly overlap in consumer behavior and, increasingly, in acquirer strategy.

Celebrity founded brands have become a visible, if numerically small, driver of dispersion at the very top of makeup and skincare pricing. A single celebrity linked transaction can move an entire year's average for a category, and the past several years have supplied more than one example. A digitally native skincare and makeup brand founded by a well known model was acquired in 2025 for up to a billion dollars against reported annual sales in the low hundreds of millions, a multiple in the mid single digits on revenue that would have been almost unthinkable for a three year old brand in an earlier era, and a figure made more remarkable by disclosures suggesting the brand had already reached a genuinely rare EBITDA margin in the mid thirties percent range before the deal closed. That combination, real profitability paired with a large built in audience, is precisely what allowed the deal to price closer to a strategic, durable brand than to a speculative, hype driven one. Contrast that with an earlier, widely referenced transaction in which a beauty conglomerate paid roughly six times trailing revenue for a majority stake in a lip focused cosmetics line built by a different celebrity founder, only to watch direct sales at that brand decline substantially in the years that followed the acquisition. Other celebrity founded brands in fragrance, color cosmetics, and skincare have at various points been reported to be exploring sale processes at valuations in the billions, yet several of those processes reportedly failed to attract a strategic buyer at the price sought, underscoring that celebrity association alone does not guarantee a premium multiple; it appears to buy a brand a hearing with acquirers, but the multiple that hearing ultimately produces still depends heavily on whether the underlying unit economics, customer retention, and channel diversification hold up to diligence. For valuation purposes, the practical takeaway is that celebrity ownership functions less as a category of its own and more as an amplifier: it widens the best case and the worst case outcome for a brand simultaneously, which is exactly the kind of dynamic that shows up in our data as elevated dispersion within makeup and skincare rather than as a clean, separately identifiable premium.

Makeup and haircare occupy the middle of the pricing spectrum, with makeup showing clearer signs of structural softening. Makeup multiples have ranged broadly from below 1x to above 8x revenue depending on the specific asset and period, but the more recent years in the dataset show fewer transactions overall and a less consistent premium than skincare or fragrance command, consistent with independent reporting that describes makeup as a category in which deal activity increasingly takes the form of divisional carve-outs and portfolio rationalization by large conglomerates rather than premium priced acquisitions of independent growth brands. Haircare, by contrast, has produced some genuinely exceptional multiples in specific years, including transactions above 8x and 9x revenue in 2016 and 2018, generally associated with scaled, professional channel brands or businesses with strong recurring purchase behavior, even as the broader category average sits closer to 2x to 3x revenue in most years.

REVENUE MULTIPLES VERSUS EBITDA MULTIPLES: WHAT THE SPREAD TELLS YOU

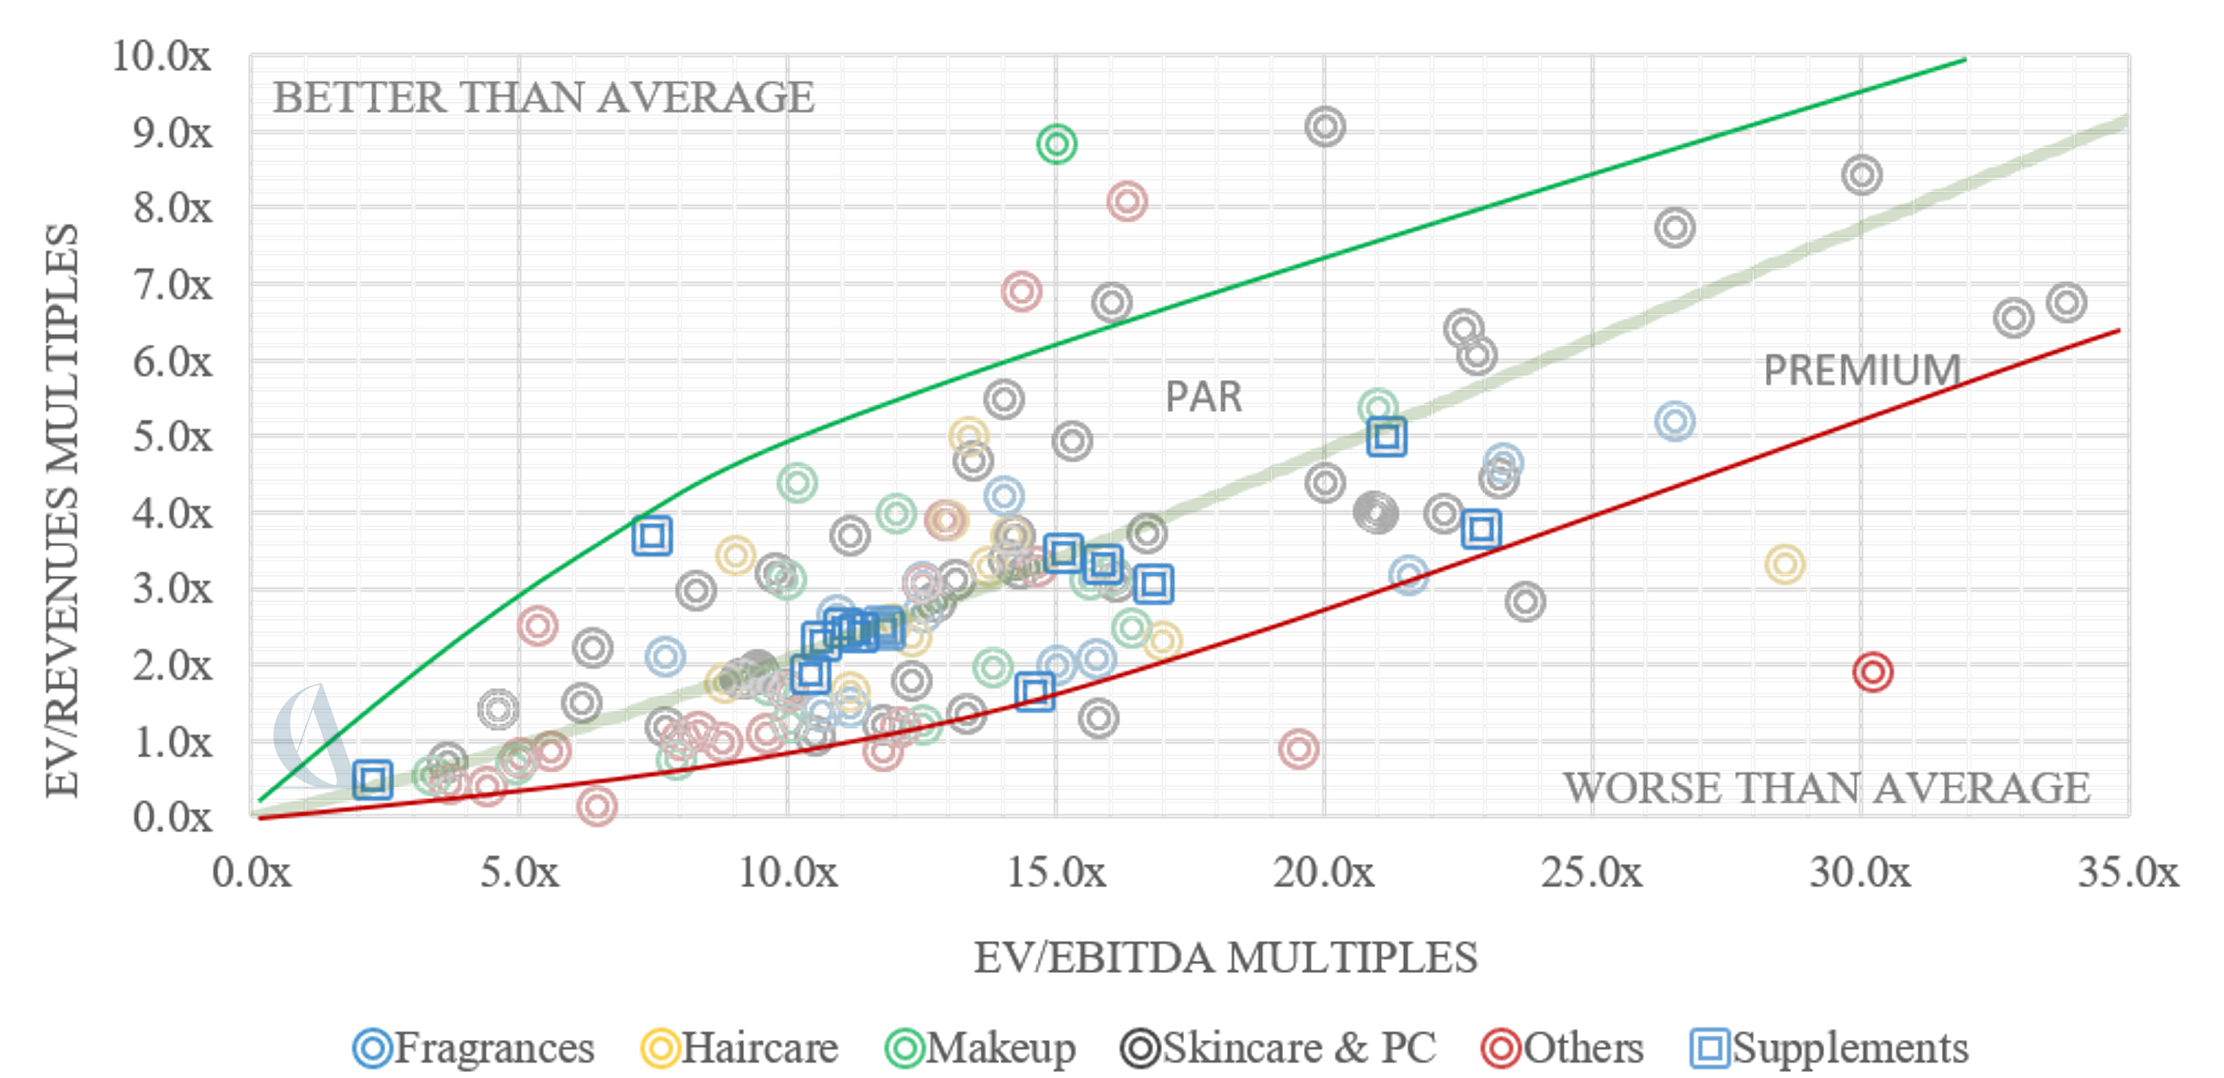
Comparing EV/EBITDA to EV/Revenue for the same transactions offers a useful, if imperfect, lens on implied margin structure, since the ratio between the two multiples is mathematically tied to EBITDA margin. Where a transaction shows a modest gap between its revenue and EBITDA multiple, for instance an EV/Revenue of 3x against an EV/EBITDA in the low teens, the implied margin is relatively healthy, in the region of 20 percent to 25 percent. Where the gap widens dramatically, an EV/Revenue of 3x against an EV/EBITDA above 30x, the implied margin is thin, often below 10 percent, suggesting either an early stage, still scaling brand, a business with heavy reinvestment in growth infrastructure, or a target where the acquirer is underwriting significant margin expansion post acquisition rather than paying for current profitability.

Our data contains several instructive examples of this pattern. A number of skincare transactions show EV/EBITDA multiples above 20x paired with EV/Revenue multiples in a more modest 3x to 5x range, precisely the profile one would expect from high growth, reinvestment heavy brands being acquired for their trajectory rather than their trailing cash generation. By contrast, the tightest, most efficient pricing in the dataset, several ingestibles and supplements transactions showing EV/EBITDA in the 10x to 12x range against EV/Revenue of 2x to 3x, implies margins in the 20 percent to 25 percent range, consistent with a mature, well run manufacturing and brand operation rather than a venture stage growth story.

Taking the yearly average EV/Revenue and EV/EBITDA figures together across the full 2009 through 2025 period and working through the implied ratio year by year, the resulting average sits close to 19 percent to 20 percent. Read literally, that figure is an implied average EBITDA margin across the full population of transacted beauty and wellness businesses over nearly two decades, and it is a genuinely informative number, because it tells us something the headline multiples alone cannot: the beauty and wellness business that actually changes hands in the M&A market, on average, is not the ultra high margin heritage luxury house that the industry's public image might suggest. A mature, scaled prestige beauty or fragrance brand with full control of its own manufacturing and distribution can often sustain EBITDA margins comfortably above 25 percent, and the very top tier of legacy luxury houses can run higher still, but those assets rarely trade hands at all, since their owners have neither the need nor, in many cases, the appetite to sell. What the 19 percent to 20 percent average margin embedded in our transaction data suggests instead is that the deal market's center of gravity sits with a broader population of still scaling, reinvestment heavy brands and mid margin manufacturing and personal care businesses, the kind of company still spending meaningfully on marketing, distribution build out, or category expansion rather than harvesting a fully mature, optimized margin structure. This is a useful reality check for both sides of a transaction. Sellers of genuinely high margin, mature assets should not assume the average multiple in our tables applies to them, since they are, almost by definition, priced away from the average. Buyers evaluating a typical target, meanwhile, should treat a 19 percent to 20 percent EBITDA margin as something close to the market's implicit baseline expectation, and should look closely at any material deviation from it, in either direction, as a signal worth investigating rather than simply banking.

This distinction matters enormously for how a seller should think about positioning a transaction and how a buyer should think about diligence. A brand priced primarily on its revenue multiple, with a correspondingly extreme EBITDA multiple, is being bought on a growth and margin expansion thesis, and the buyer's underwriting case rests heavily on assumptions about future operating leverage that a seller should expect to be tested hard during diligence. A brand priced on a more moderate, tightly coupled revenue and EBITDA multiple is being bought closer to its current economic reality, with less reliance on a story about the future.

WHY 2025 AND EARLY 2026 LOOK DIFFERENT FROM WHAT CAME BEFORE

Three external forces help explain why average multiples moved as they did through 2025 and into the early part of 2026, and why we would caution against reading the recent uptick as a simple return to the exuberance of 2019 through 2021.

The first is the interest rate cycle. The five rate cuts delivered by the Federal Reserve beginning in September 2024, totaling roughly 150 basis points, materially improved the cost and availability of acquisition financing relative to the tighter conditions of 2022 and 2023, and private credit lenders have continued to compete aggressively on spreads, creating what several advisory firms now describe as a genuinely borrower friendly financing backdrop heading into 2026. Cheaper, more available debt supports higher enterprise values for a given level of cash flow, and this alone accounts for a meaningful part of the multiple recovery visible in the 2025 data.

The second is a widening gap between financial sponsor and strategic buyer pricing. Broader private market data outside beauty specifically shows sponsors now paying, on average, close to three additional turns of EBITDA relative to strategic buyers, a function of the roughly two and a half trillion dollars of private equity dry powder still seeking deployment and the intensity of competition among sponsors for a limited pool of genuinely scarce, high quality assets. In beauty specifically, this dynamic appears to be concentrating at the very top of the market: truly differentiated brands, those with defensible clinical credentials, category leadership, or a clear path to global scale, are attracting multiple competing bidders and clearing at exceptional multiples, while the broader, less differentiated middle of the market continues to see buyers underwrite more conservatively and sellers accept a wider valuation gap than they might have tolerated in 2021.

The third, and in our view the most important for anyone trying to build a forward view, is the accelerating convergence of beauty with wellness and longevity as a consumer and investment thesis. The growing mainstream adoption of GLP-1 medications and other health prioritization trends has been described by several industry observers as a genuine multiplier effect across adjacent categories, from ingestible supplements supporting metabolic health and skin quality to aesthetic procedures and devices addressing changes in body composition, and this convergence is visible in the growing willingness of both strategic and financial buyers to pay premium multiples for assets that sit credibly at the intersection of beauty and health rather than in either category alone. Several of the highest multiple transactions in our recent data, both the fragrance outlier in late 2025 and the elevated ingestibles pricing observed into 2026, are consistent with a market that increasingly rewards a demonstrable connection to consumer health and longevity narratives over conventional category positioning.

It is also worth noting, in the interest of balanced interpretation, that 2025 was a genuinely unusual year for the underlying beauty industry, one in which reported global beauty revenue growth turned negative for essentially the first time outside of a broader macroeconomic recession, driven by a well documented combination of decelerating Chinese consumer demand, currency headwinds for globally reporting companies, and the early impact of tariff escalation in the United States. That this backdrop coincided with rising rather than falling average deal multiples reinforces a theme we have highlighted before: beauty M&A pricing tracks forward conviction about specific assets far more closely than it tracks trailing sector level financial performance.

WHO IS ACTUALLY BUYING: A SHIFTING ACQUIRER MIX

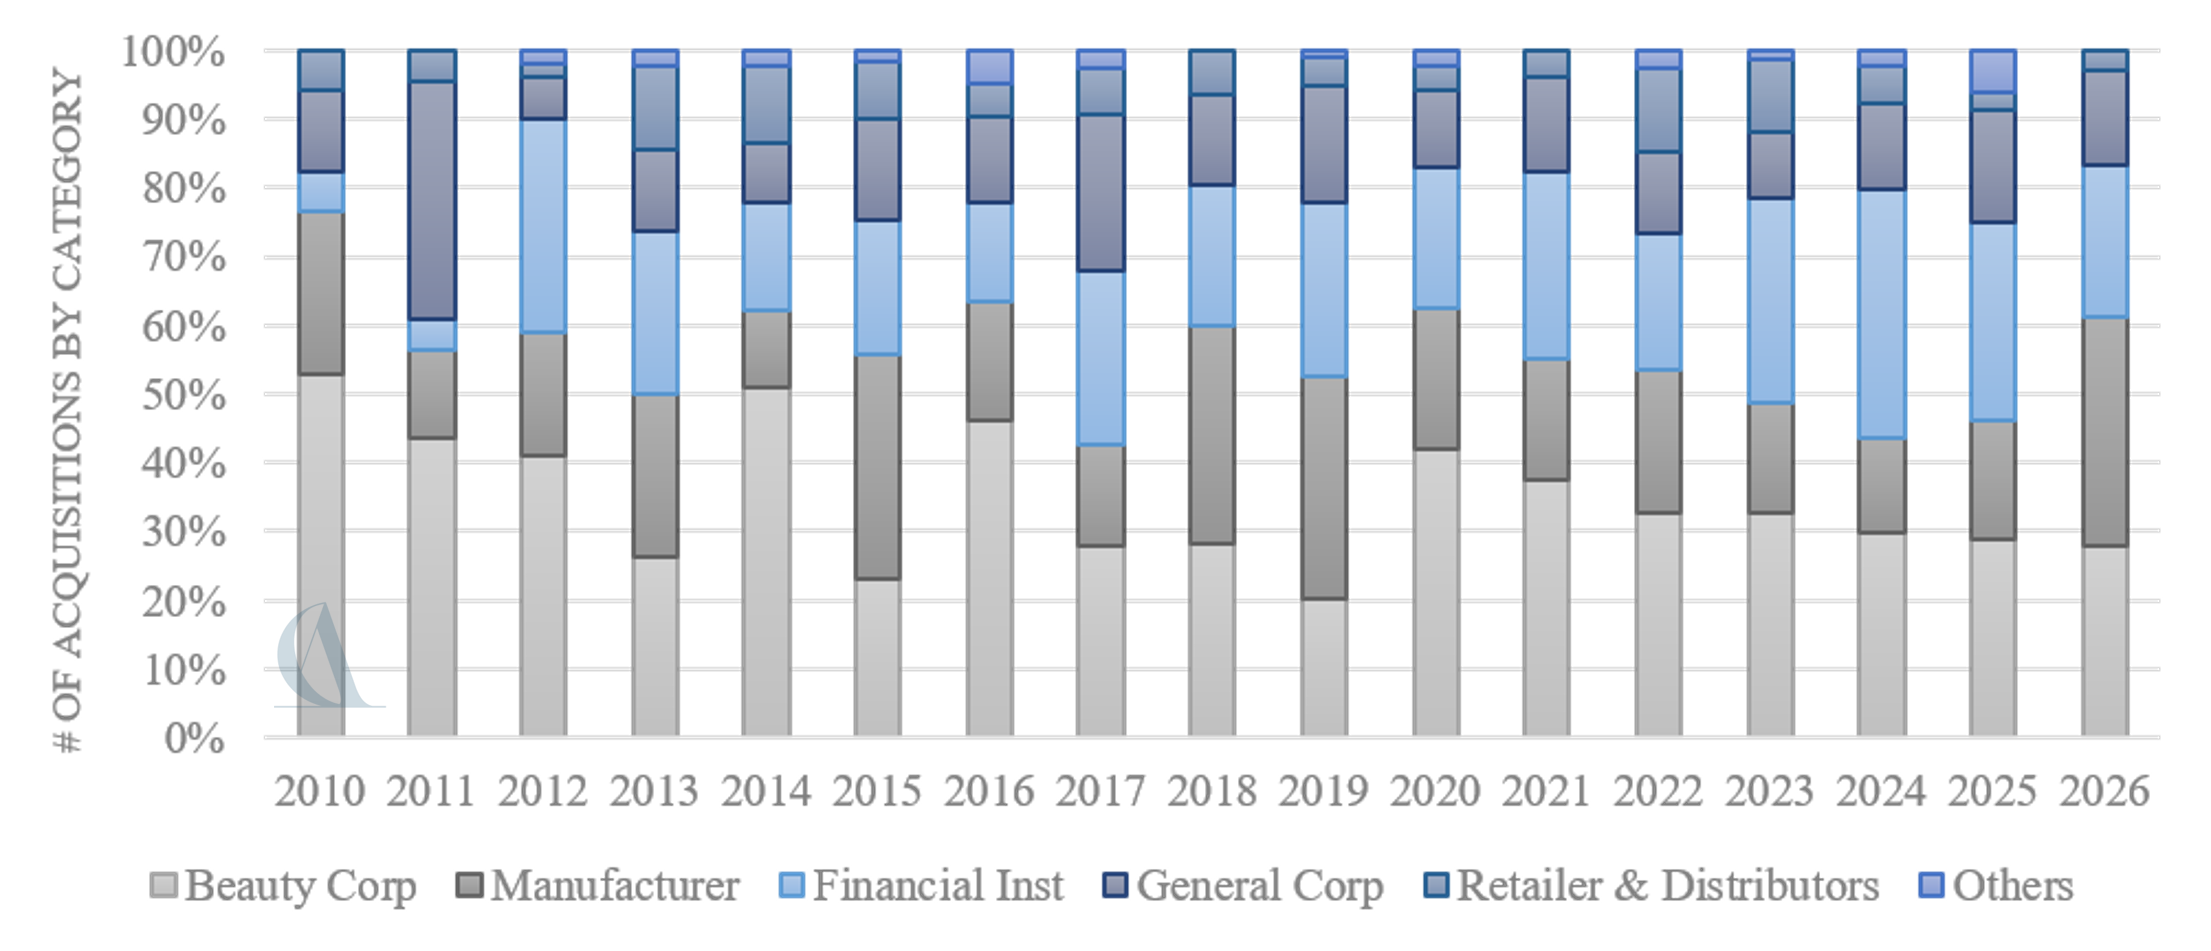
Multiples do not move in a vacuum, and one of the more revealing complements to the pricing data is our proprietary breakdown of who has actually been doing the buying across this period, split between strategic beauty corporates, manufacturers, financial institutions, general corporates outside the core beauty industry, retailers and distributors, and a small residual category of other buyers. We would caution against reading precise figures into any single year, particularly the still incomplete 2026, but the relative shift in shares over time lines up closely with the pricing story above and adds useful texture to it.

The clearest pattern is the rise and fall of financial institutions as a share of total dealmaking. Their presence was negligible before the financial crisis, then jumped sharply in relative terms in the early part of the following decade as private capital began deploying more actively into consumer and beauty assets. That share receded somewhat in the middle years of the last decade as manufacturers and strategic beauty corporates took a larger share of activity, only to climb back to its highest levels of the entire period in 2023 and again in 2024, a stretch in which financial institutions accounted for close to a third, and in the strongest year, more than a third, of all recorded transactions. That climb aligns closely with the low interest rate tail end of the post pandemic financing environment and the wall of private equity capital raised over the prior several years finally finding beauty and wellness targets to deploy into. The subsequent pullback in relative share during 2025 is real, and consistent with widely reported private equity caution through much of that year, but it is worth being precise about what actually happened: financial institutions did not disappear from the market, their share simply normalized back toward rough parity with strategic beauty corporates rather than continuing to set new records, a meaningfully different story from an outright retreat.

Strategic beauty corporates show a complementary but distinct pattern, with their relative share of deal activity peaking most sharply in 2020, the pandemic year in which financial sponsors pulled back and cash rich strategics with resilient balance sheets stepped in to consolidate a temporarily less competitive market, a dynamic several advisors have described as strategics using a moment of financing uncertainty among sponsors to acquire assets they might otherwise have had to compete harder for. Manufacturers, by contrast, had their strongest relative period earlier, roughly between 2015 and 2019, a stretch that lines up closely with the wave of consolidation among contract manufacturers and private label platforms seeking to move up the value chain by owning finished brands rather than simply producing for others, and their share has settled to a more modest, steadier level since. Retailers and distributors are a smaller part of the market in every year, but their relative share rose noticeably in 2022 and 2023, a period that coincided with visible retail consolidation and vertical integration moves across the beauty specialty channel, before falling back toward more typical levels in 2024 and 2025.

Taken together, the acquirer mix data reinforces a theme that runs through the multiples themselves: the beauty M&A market is not a single market with one dominant type of buyer, but a rotating set of overlapping cycles, financial institutions cycling with the cost and availability of leverage, strategics cycling with their own portfolio priorities and balance sheet capacity, and manufacturers and retailers each having had a distinct window in which their strategic logic for owning brands outright was strongest. Anyone running a sale process should think carefully about which buyer type is likely to be most active, and most competitive on price, at the specific point in the cycle when their process will actually be in market, rather than assuming the buyer universe that was dominant two or three years earlier will still be the one setting the price today.

PRACTICAL IMPLICATIONS FOR BUYERS, SELLERS, AND ADVISORS

Several conclusions follow from this analysis that we would encourage anyone active in beauty and wellness dealmaking to weigh carefully.

Category alone is no longer a reliable pricing signal. The dispersion within skincare, and increasingly within fragrance, is now wide enough that quoting a single average multiple for either category is close to meaningless for valuing a specific asset. What increasingly determines where a given transaction lands within that wide range is a narrower set of qualitative factors: clinical or scientific credibility, evidence of durable rather than trend driven consumer demand, margin quality, and channel diversification away from a single retail or digital dependency.

The revenue to EBITDA multiple spread is an underused diagnostic tool. Sellers preparing a business for sale should understand clearly which story they are telling the market, a growth and margin expansion story that will be priced primarily on revenue, or a cash generation story that will be priced more conventionally on EBITDA, and should prepare their financial narrative and diligence materials accordingly. Buyers should treat a wide gap between the two multiples as an explicit signal to stress test the margin expansion assumptions embedded in their own underwriting.

Owned brand intellectual property is increasingly worth a separate, explicit premium, particularly in fragrance. Sellers holding wholly owned brand IP, formulas, and heritage should expect, and should be prepared to justify, materially higher multiples than businesses built primarily on a licensing relationship with a third party brand owner, since buyers are now pricing license renewal risk far more explicitly than they did a decade ago. Businesses whose revenue depends on a royalty agreement with a fixed term should expect that dependency to be a specific, quantified discount in any process, not a background risk factor.

Celebrity association widens outcomes rather than guaranteeing a premium. The data and the recent transaction record both suggest that a well known founder can accelerate a brand's path to a sale conversation and can support an exceptional multiple where real unit economics and retention back it up, but it can just as easily produce a rich valuation that the business subsequently struggles to grow into, or a process that fails to attract a strategic buyer at all. Buyers should diligence a celebrity founded brand on the same fundamentals, durable customer retention, defensible margin structure, and channel diversification, that they would apply to any other target, treating the founder's public profile as a distribution asset to be valued on its own merits rather than as a substitute for those fundamentals.

Ingestibles and supplements deserve more attention than their historical multiple levels might suggest. The tightness and consistency of pricing in this category through most of the period we reviewed is itself a signal of a maturing, well understood market, and the growing convergence between beauty and health positioning suggests this category is more likely to see multiple expansion than mean reversion over the coming several years, notwithstanding the need for caution around the single extreme data point recorded in 2026.

The gap between top tier and mid tier assets is likely to keep widening before it narrows. Every signal in the current environment, financing conditions, private equity dry powder, and the growing premium attached to scarcity and clinical credibility, points toward a market that will continue to reward the very best assets in each category with exceptional multiples while leaving a larger and more challenging path to exit for good but not exceptional businesses. Sellers contemplating a process in the next twelve to twenty four months should assess honestly which side of that divide their business sits on before setting price expectations.

2026 data should be read with real caution for now. The small number of transactions recorded so far in 2026, including the extreme outliers already visible in ingestibles and in the broader others category, are simply too few to support firm conclusions about a new baseline, however striking some of the individual figures may be. As we noted in our review of 2026 deal volume, the historical pattern in this dataset is one of second half weighting, and a fuller and more reliable picture of where 2026 multiples will ultimately settle will only be available once a larger sample of full year transactions has closed.

CLOSING THOUGHT

Seventeen years of transaction data make one thing clear beyond reasonable dispute: beauty and wellness M&A has never been priced as a single, homogenous market, and it is becoming less so with every cycle. The average multiple tells you the temperature of the room, but the dispersion within each category, and the relationship between what buyers pay for revenue and what they pay for profit, tells you who is actually winning capital and why. In a market where a fragrance house can command sixteen times revenue in the same year that a distressed personal care asset changes hands for a tenth of its sales, the most valuable skill for any operator, investor, or advisor is no longer knowing the average. It is knowing precisely where a given asset sits within the range, and why.

Next
Next

From Appearance to Affect: The Neuro-Emotional Pivot in Prestige Beauty